Observability setup
When to use this
You run Graftcode in production (or staging) and need correlated logs and traces across Graft calls — caller, Gateway, and receiver — using tools you already operate (OpenTelemetry, Application Insights, Grafana, Datadog, ELK, and so on).
Conceptual background: Observability, tracing, and context propagation.
Prerequisites
- Services that emit logs or traces today (or a plan to add them)
- Caller and receiver both running Grafts (or one side in-memory in the same process)
- For Gateway diagnostics: access to GG console output and Graftcode Vision
What Graftcode provides (and what it does not)
| Graftcode provides | Graftcode does not provide |
|---|---|
| Trace and span context propagated inside IIP invocation intent across Hypertube boundaries | A proprietary APM backend or log aggregator |
| Continuous trace chains across in-memory, polyglot, and remote execution | Payload logging or business-data export to the cloud |
| Exception propagation with context intact | A replacement for your logging framework |
Integration model: keep your existing observability stack. Graftcode ensures context crosses runtime boundaries so your exporters and log pipelines can correlate caller and callee the same way they do for HTTP or gRPC.
You do not install a separate Graftcode observability SDK. Generated Grafts carry the runtime bridge; wire correlation into the logging and tracing you already use.
Step 1: Use structured logging with correlation fields
Ensure every service logs structured fields, not plain text only. At minimum include:
trace_id/traceId(W3C trace context when using OpenTelemetry)span_id/spanId- A business correlation ID if your org uses one (
correlationId,requestId, …) - Service name and environment
TypeScript (example with OpenTelemetry context):
import { trace } from "@opentelemetry/api";

const span = trace.getActiveSpan();
const spanContext = span?.spanContext();

logger.info("Processing order", {
  orderId: "123",
  traceId: spanContext?.traceId,
  spanId: spanContext?.spanId,
});
.NET (example with ILogger and OpenTelemetry):
using Microsoft.Extensions.Logging;

_logger.LogInformation(
    "Processing order {OrderId}",
    orderId);
// With ASP.NET Core + OpenTelemetry instrumentation, trace/span IDs
// are attached automatically when logging scopes are enabled.
Python (example):
import logging

logger = logging.getLogger(__name__)
logger.info("Processing order", extra={"order_id": "123"})
# Attach OpenTelemetry LoggingInstrumentor or read active span context
# and add trace_id / span_id to `extra` if your backend expects them.
Apply the same pattern on both the caller and the service behind the Gateway. If only one side emits trace IDs, distributed traces will fragment.
Step 2: Enable distributed tracing with OpenTelemetry
OpenTelemetry is the recommended integration path. Graftcode does not require a custom exporter — use the SDK and backends you already run.
Typical setup per service:
- Install the OpenTelemetry SDK for your runtime (.NET, Node.js, Python, Java, …).
- Register a TracerProvider with your exporter (OTLP, Jaeger, Azure Monitor / Application Insights, etc.).
- Enable auto-instrumentation where available (HTTP, ASP.NET Core, FastAPI, …).
- Deploy the same trace context format (W3C
traceparent) across all services in the call chain.
Official starting points:
Graft calls propagate trace context inside IIP, not as HTTP headers. Your application code usually stays unchanged; ensure the active span context at the call site is picked up by Graftcode's runtime bridge (same as any in-process call in that runtime).
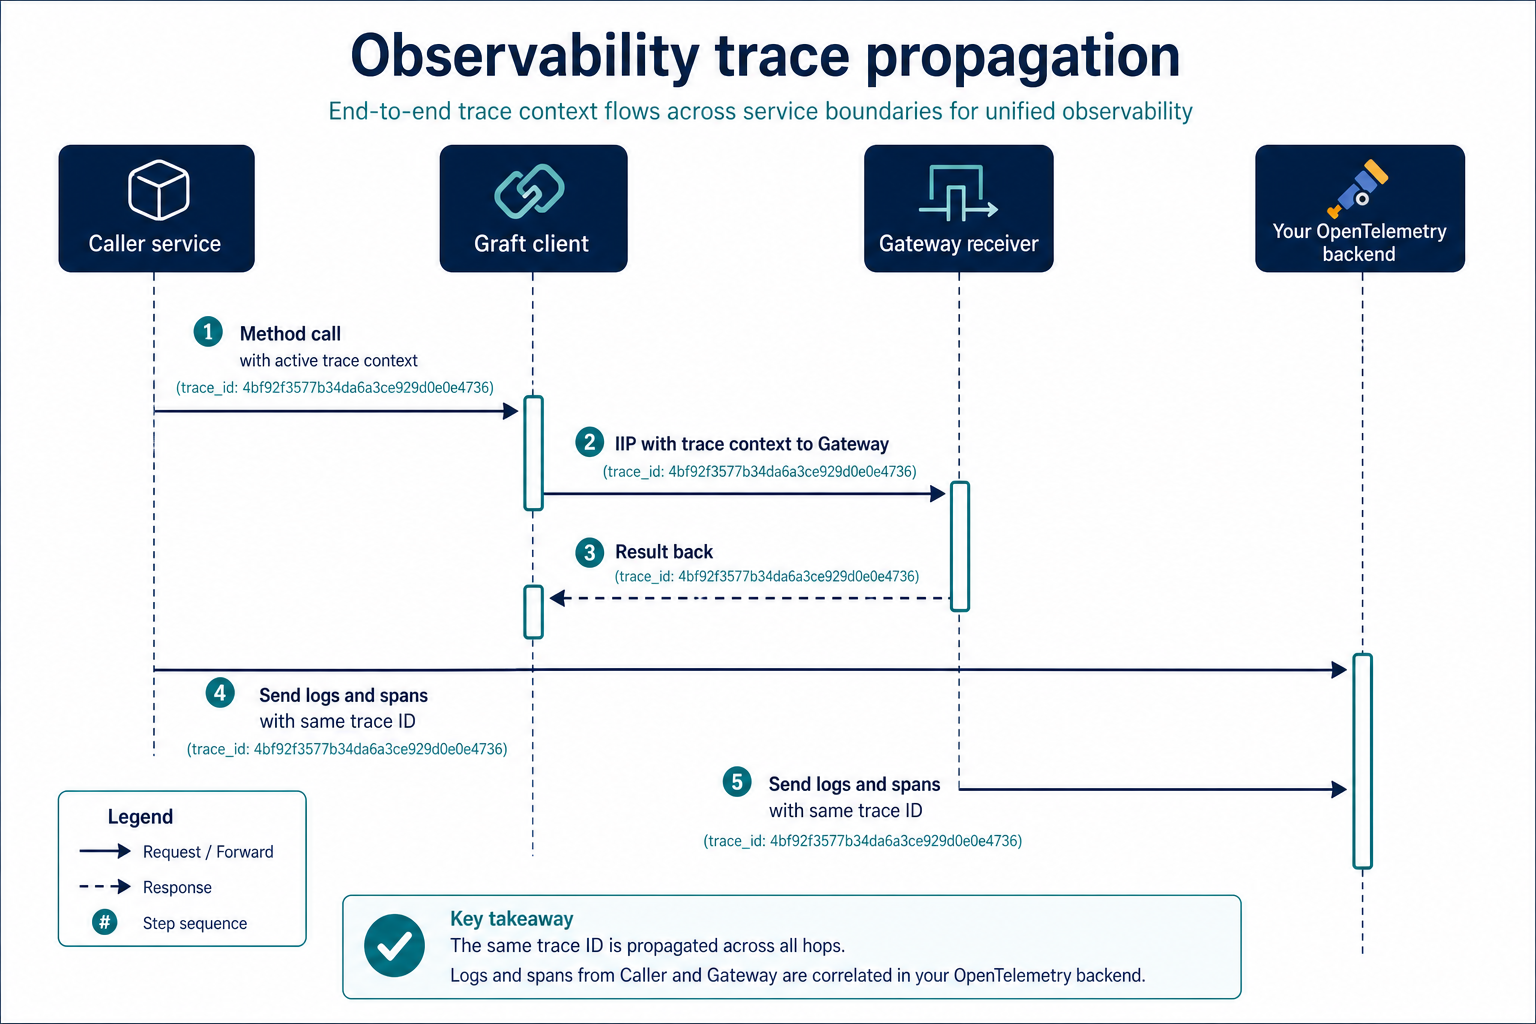
Step 3: Understand trace propagation across Graft boundaries
When a Graft call crosses processes:
- The caller creates or continues a distributed trace (via your OTel setup).
- Trace context is embedded in the IIP invocation intent sent over Hypertube.
- The receiver (Gateway-hosted runtime) continues the same trace for its spans and logs.
- Results and exceptions return with context preserved.
This works for:
- Remote calls (
GraftConfig.hostset totcp://orws://) - In-memory and polyglot execution (same process, different runtimes)
- Stateful sessions (callbacks and events stay within the same trace when your stack supports it)
For load-balanced Gateways, combine with Stateless vs stateful execution and Scaling, load balancers, and proxies.
Step 4: Gateway and Portal visibility
Use the right tool for each observability layer:
| Layer | Tool | Use for |
|---|---|---|
| Functional testing | Graftcode Vision | Inspect exposed methods, try calls, copy install commands |
| Protocol debugging | GG_DEBUG=1 | Byte-level IIP traffic in GG console — dev/troubleshooting only (Debugging runbook) |
| Project analytics | Graftcode Portal / Insights | Aggregated call counts, latency, version usage when bound to a Project Key — not a substitute for full APM |
| Production APM | Your OpenTelemetry / cloud monitor stack | Traces, logs, alerts, SLOs |
GG_DEBUG is verbose and not suitable for production. Use it only when diagnosing wire-level issues.
Step 5: Correlate errors across services
When a Graft call fails:
- The exception type and message propagate to the caller (native to your language).
- Trace context should remain attached so your APM shows one connected trace, not isolated spans.
In your runbooks, search by trace ID first, then by business correlation ID. See Troubleshooting runbook for symptom-based fixes.
Verify it works
- Trigger a Graft call that crosses at least two services (or caller + Gateway receiver).
- Confirm the same trace ID appears in caller and receiver logs (or in your tracing UI).
- Confirm spans link parent → child in Jaeger, Application Insights, Grafana Tempo, or your backend.
- Induce a controlled failure and verify the trace shows the error on both sides.
If traces break at the Graft boundary, check that both services export OTel and that structured logs include trace identifiers — not that a separate Graftcode logging package is missing.
Common mistakes
| Mistake | Fix |
|---|---|
| Traces stop at the Gateway | Enable OTel and structured logging on receiver services, not just callers |
| Only plain-text logs | Add structured traceId / spanId (or use OTel log correlation) |
Using GG_DEBUG in production | Use OTel + your APM; reserve GG_DEBUG for local protocol diagnosis |
| Expecting Portal Insights to replace APM | Portal metrics are aggregated and non-payload; keep fine-grained telemetry local |
| Stateful calls behind a load balancer | Session stickiness or stateless interfaces — see Stateless vs stateful |
See also
- Observability, tracing, and context propagation — concepts
- Debugging runbook —
GG_DEBUG, Vision health checks - Environment variables —
GG_DEBUG, Project Key - Scaling, load balancers, and proxies
- What goes to Graftcode Cloud — data boundaries
- Visual assets guide — all diagrams and screenshots